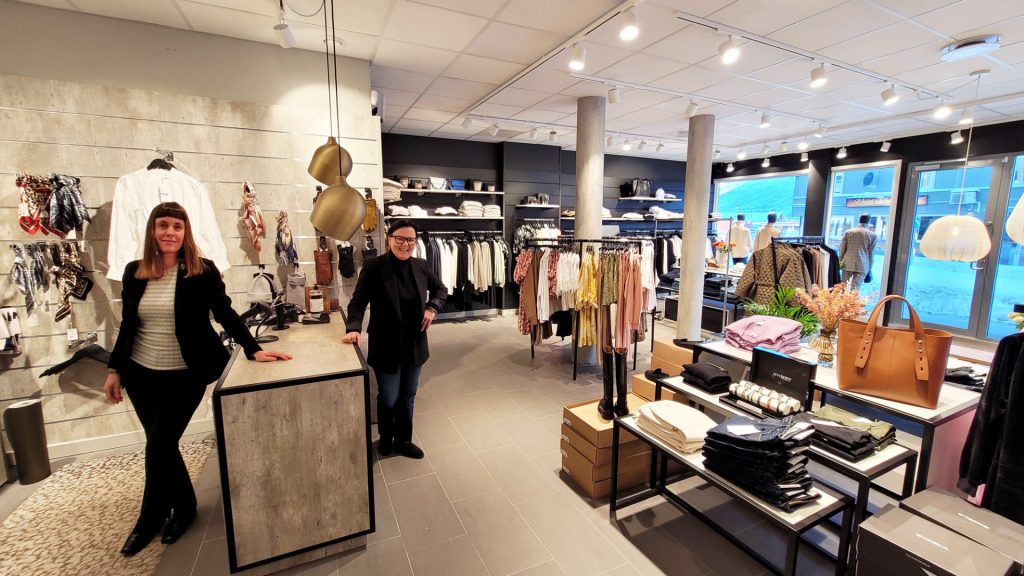
Texcon larger growth than other chains
The fashion industry continued its positive trend in 2022 with a 10.2% growth compared to the year before. The 25 largest chains increased their market share to 69%. According to Virke Retail Index and Kvarud Analyse Shopping Centre Index, Texcon undoubtedly had the largest growth among the chains.

Sales in 2022 are just above the figures for 2019, which was a normal year. 2022 was barely affected by the pandemic and the figures suggest that physical stores have taken some of the sales from online-only stores. This is reflected by weaker growth in the purchase of clothing from online-only stores compared to the trend in the whole market. Virke Retail Index estimates that purchases from online-only stores increased by 8% in 2022.
Ten of the chains had a double-digit sales growth from 2021 to 2022. These were Only Stores 29.2%, Texcon 25.7%, Volt 25.2%, Dressmann 24.5%, Floyd 19.7%, Junkyard 19.4%, Change 15.7%, B.young 13.7%, Boys of Europe 13.1%, Lindex 12.1%.
The growth rate of the chains was the same as for independent retailers, which is new this year. In the past, the growth rate of the chains has been higher than the growth rate of independent retailers. The 25 chains in Virke’s sample increased their market share to 69% in 2022.
Strong growth for Texcon
H&M continues to be the largest with a sales turnover of MNOK 3.4 and market share of 11.2%. However, the Texcon cluster consisting of a network of independent purchase-collaborating retailers has grown considerably in 2022 falling just behind H&M with a sales turnover of MNOK 3.2 and market share of 10.5%. Texcon gained more members in 2022 with 17 stores. This confirms that Texcon’s members are ardent drivers and that there are advantages to being part of a community.
“The members are doing a great job.”
The general manager of Texcon, Thomas Vethe, is naturally very happy with the trend.
”It’s important to stress that the strong growth of MNOK 662 from 2021 to 2022 is two-fold. There was a substantial increase in the number of members with 17 new stores and our member stores have done an excellent job in their markets with good customer service, products and highly competent employees. They have a solid position in their local communities, they know their customers well, and have understood that customer journeys start earlier than before. It’s more important than ever to be present in more channels than just a physical store, on social media and online. They’ve been doing a good job for several years and are continuing the solid effort they made in 2021. A sales growth of MNOK 662 is impressive, so it’s just a matter of saying congratulations to our clever members, and the new stores, who are also doing an excellent job,” Vethe says.
Fewer stores In Virke’s sample of 25 chains, there was a fall in the number of stores by 54 in 2022 bringing the total to 1,709 stores. In addition to Texcon, four other chains increased the number of stores in 2022. These were Change (3), Floyd (2), KappAhl (1) and Høyer (1). Twelve chains reduced the number of stores. Match (23) and VIC (21) had the largest decline, which is a consequence of Voice deciding they
would only have the stores they own in their chains. Cubus reduced their stores by ten and H&M had nine less stores during the course of the year.
Increased sales per store
All stores had an average sales growth of 13.4%. The average sales growth per store was MNOK 16.8.
Virke’s overview includes the largest chains in Norway with the exception of the Bestseller chains. Bestseller Stores Norway had a sales turnover of MNOK 586,611 in 2022 – a 31% increase since 2021.
Imports: Value up, volume down
The value of Norwegian imported textiles has increased on average by 6.3% per year since 2016. In 2022, this was 9.2%. However, when measured by volume, imports have on average fallen by 1% per year since 2016, with a 2.4% decline in the last year.
- The analysis was based on a sample of 25 fashion chains out of around 90 in Norway.
- The figures were retrieved from Kvarud Analyse Shopping Centre Index and processed by Virke Retail Index.
- The chains in the sample represent 69% of the market.
- The largest fashion chains were primarily in the sample with a few exceptions, for example, Bestseller chains.
- The size of the market in 2022 was estimated based on Statistics Norway’s periodic statistics up until P5 2021, and further estimated with the changes to the commodity trading index for fashion retailers the rest of the year.